How to Count Unique Order IDs in an Excel PivotTable
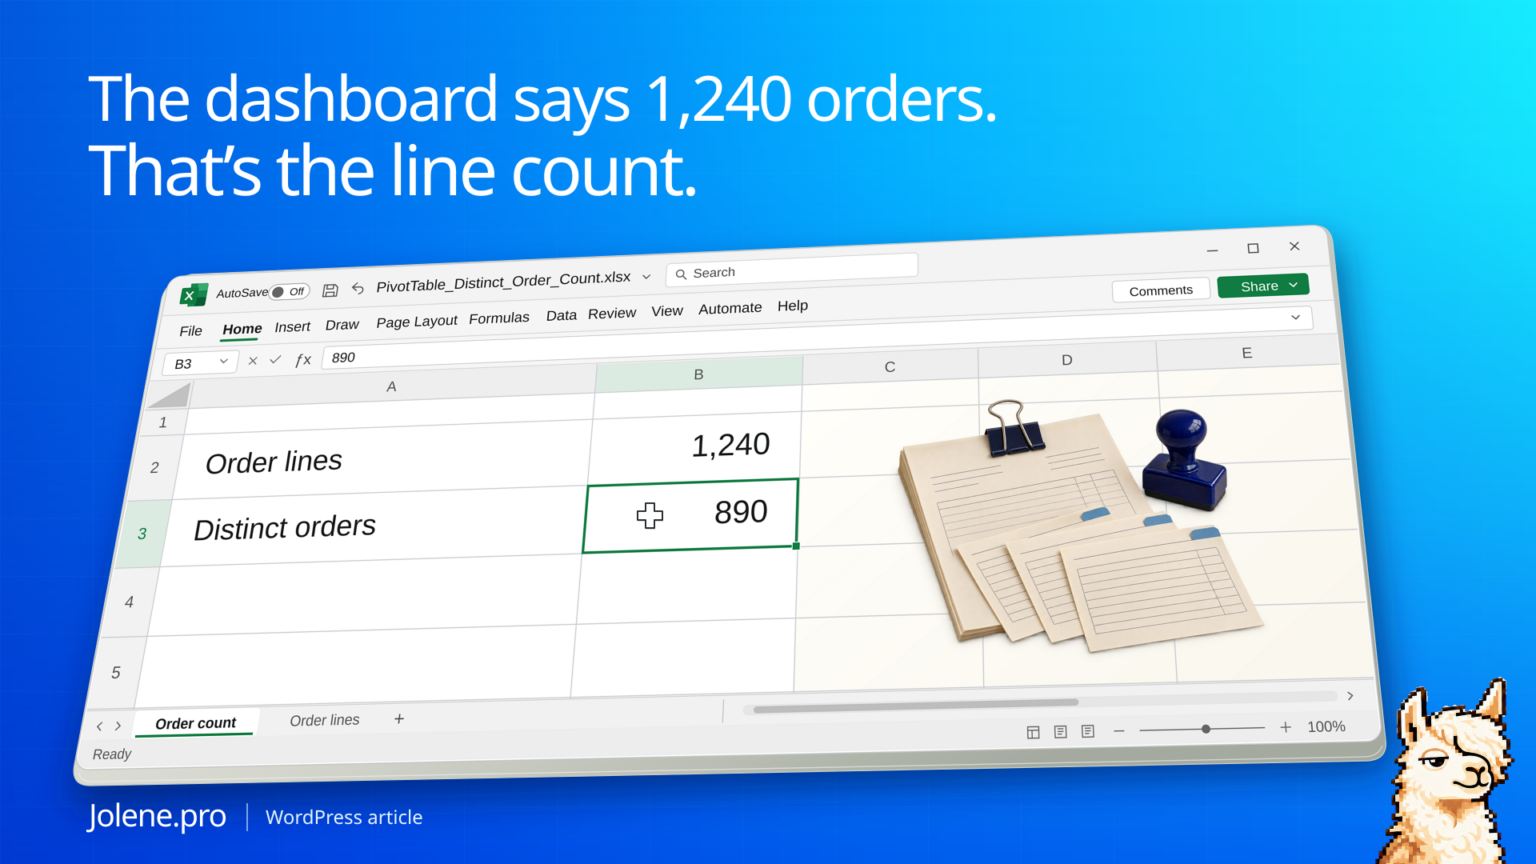
A line-item export can have 1,240 rows and only 890 orders. If the dashboard labels its row count as Orders, the team is reporting order lines under the wrong heading. The same distinction is visible in the five-row example below.
Use a distinct count of valid order IDs for order volume, a row count for order lines, and a sum of quantity for units. Fill or recover order IDs only where the export’s structure supports it.
Three different counts from five rows
The following rows reproduce the distinction on a smaller order file.
| Order | Line | Units |
|---|---|---|
| #201 | 1 | 2 |
| #201 | 2 | 1 |
| #202 | 1 | 1 |
| #203 | 1 | 3 |
| #203 | 2 | 1 |
There are three orders, five lines and eight units. Set the metric by what the report is meant to answer before choosing a PivotTable value field.
Reproduce the three measures in Excel
Create a sheet named Order Lines. Paste this tab-separated sample into A1. It represents one store and one reporting period, with one row per valid order line. It is a teaching extract, not an unmodified Shopify export.
Order	Line	Units
#201	1	2
#201	2	1
#202	1	1
#203	1	3
#203	2	1
The source occupies Order Lines!A1:C6. Order #201 uses rows 2:3 and totals three units. Order #202 uses row 4 and has one unit. Order #203 uses rows 5:6 and totals four units. Together they give three orders, five lines and eight units.
For a supported Excel desktop setup, select A1:C6, choose Insert → PivotTable, and enable Add this data to the Data Model. Add Order to Values and choose Distinct Count in Value Field Settings. Add Line to Values with Count, and Units with Sum. Name the measures Orders, Order lines and Units. With no report filters, their grand totals should be 3, 5 and 8. Count of Order would instead return 5 for these five populated rows.
If Distinct Count is missing
The PivotTable Distinct Count choice requires the Data Model. If your Excel setup does not offer that workflow, keep the source intact and build a separate one-row-per-order summary. In an Excel version with UNIQUE, you can also check the five-row example with these worksheet formulas. The order-count formula stops for review when an order ID is blank.
Orders: =IF(COUNTBLANK(A2:A6)>0,"Review blank order IDs",ROWS(UNIQUE(A2:A6)))
Order lines: =ROWS(A2:A6)
Units: =SUM(C2:C6)
Use these formulas on the Order Lines sheet or qualify the ranges with its name. English function names and comma argument separators are shown. The fixed ranges cover only this supplied sample. Keep the original line table for quantities. Do not use UNIQUE with its exactly_once option set to TRUE to count orders: that would retain only #202 here and miss the two orders that span multiple lines.
A blank-key check the grand total can miss
In a copy of the exercise, clear A3 while leaving B3:C3 unchanged. The sheet still has five rows and eight units. Three known order IDs also remain, because #201 still appears in A2. Yet one line now lacks an order assignment. =COUNTBLANK(A2:A6) returns 1, and the guarded Orders formula asks for review. A familiar-looking distinct total does not prove every line is assigned correctly. Restore #201 in A3 after the check.
For a real export, recover a blank key only from documented row grouping or a reliable order reference. Keep unresolved lines in the exception list. Across multiple stores, count the verified store plus order ID key; matching display numbers alone can combine separate orders. Apply the same dates and order-status rules to both the dashboard and the source before comparing totals.
Why product subtotals may not add up
An order can contain several products. It may count once under each product but only once in the distinct-order grand total. Do not sum product-level distinct counts to calculate total orders.
Check that the dashboard uses the right definitions
Put the order-line extract and the published KPI totals in separate tabs. Include the filter period and the definitions used on the dashboard.
Count distinct orders, order lines and units separately. Flag blank order IDs, explain any dashboard discrepancy, and cite the source rows.
Name the three measures clearly. A table labelled Orders should let the reader tell which of the three it uses.
Shopify order export row structure · Microsoft on PivotTable summary functions · Microsoft on Power Pivot aggregation
The figures and identifiers are synthetic. Counts and quantities were checked independently. Native Excel PivotTable execution and a live Jolene.pro result were not verified.
Try this with your own spreadsheet at Jolene.pro. Follow Jolene.pro on LinkedIn for more spreadsheet guides.
References and related checks: Microsoft UNIQUE documentation · PivotTable source missing new rows · Workbook Studies.