Occupancy Held Steady. Why Did Property Income Fall?
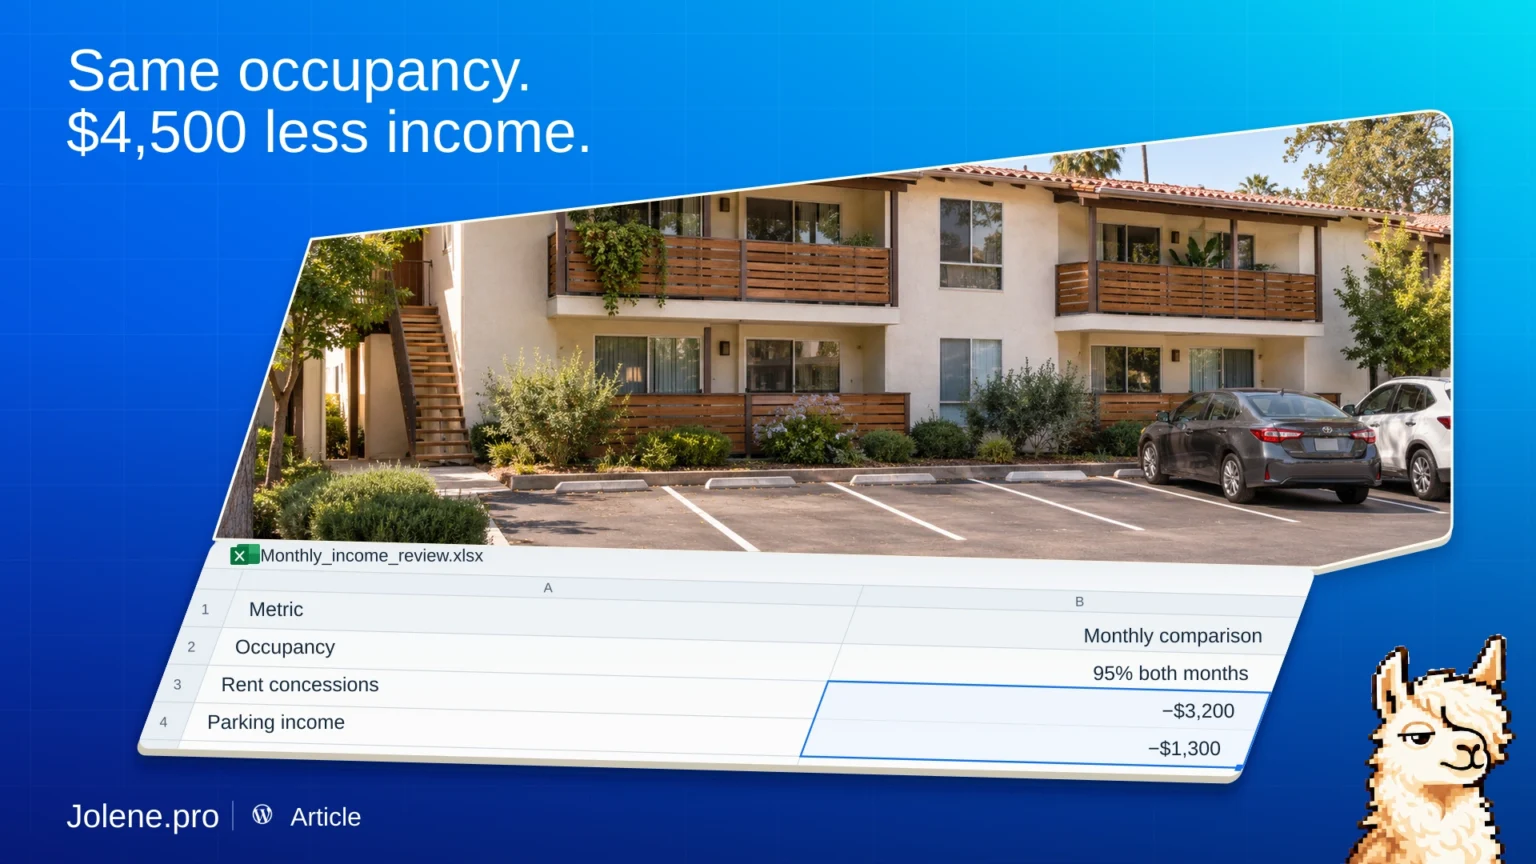
The property is 95% occupied for a second month. Income is $4,500 lower. The owner is going to ask why, and the occupancy chart can only get you so far.
Bring the detail behind the owner report
If you work in Excel, pull the current and prior month P&Ls plus the ledger behind the largest income lines. Use the same properties and accounting basis in both months.
If you use Buildium or QuickBooks Online, start with the Rental Owner Statement as a reference or export the QuickBooks P&L to Excel. Add the detailed transactions used for the comparison.
Explain the biggest changes first
Compare income by property and account. Trace the largest differences to the underlying entries. Separate ongoing changes from one-offs and flag anything that needs a posting check.
In this example, $3,200 in new concessions and $1,300 less parking income explain the decline. The concessions go to leasing for review and the parking variance goes to the person who manages parking revenue.
What to ask Jolene.pro
What explains the drop in income by property and account? Show the largest drivers and their ledger rows.
Put those two drivers in the opening paragraph of the owner update.