How to Compare Fuel Delivery Margins by Route
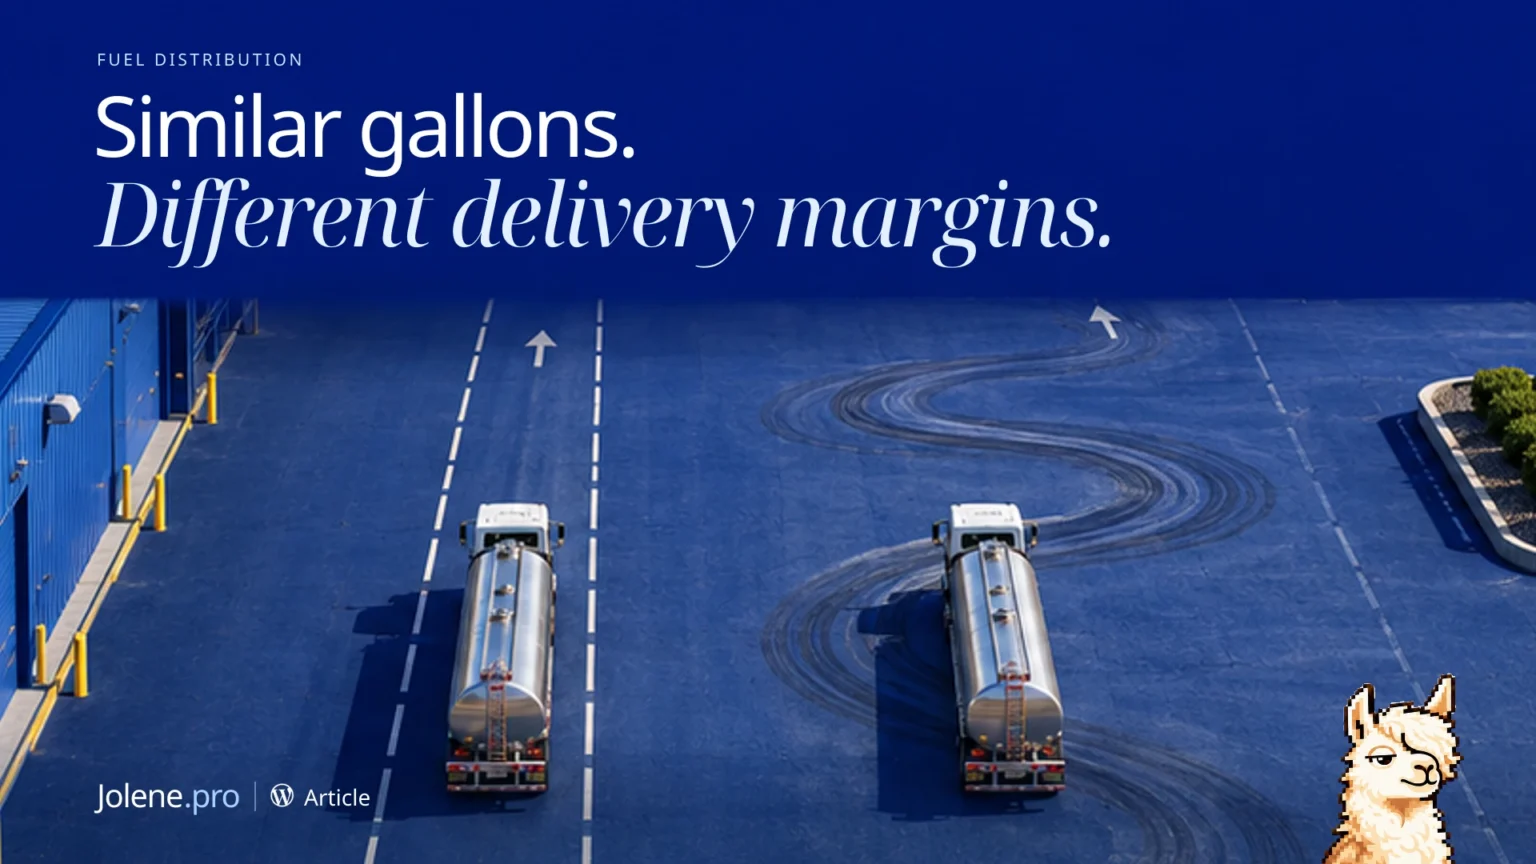
Two routes deliver similar volume. One serves smaller drops farther apart. A route-level view shows how much margin is left after delivery cost.
What to pull
Use Excel sales, product cost and route logs, or export invoice lines, inventory costs and driver hours from your billing, ERP and dispatch systems. Include mileage and tolls where available.
How to check it
Link billed deliveries to trips. Apply the approved product-cost basis and document shared delivery-cost allocations. Compare margin per delivered gallon for comparable routes.
Which routes lost the most margin after delivery costs? Show product margin, delivery cost and source rows.
What to do with the result
Review routes with recurring low contribution before changing frequency, drop size or delivery fees.
Use approved costing rules and verify allocated costs before making pricing decisions.